The Paycheck Protection Program was designed to provide government-guaranteed forgivable loans to small businesses affected by the COVID19 crisis. The loans are meant to keep employees on payroll as well as keep up with mortgage and rent payments. The $349 billion allocated for the program ran out in less than two weeks, prompting lawmakers to approve a second round of funding for $310 billion.
The Federal Reserve Bank of New York’s “Liberty Street Economics” blog analyzed the loan allocation data for the first round of PPP, in an effort to explain the geographic distribution of the loans. The authors were able to find some correlations but indicated more work was needed to identify causality. CAMEO’s Senior Advisor, Mark Quinn took a look at the analysis and came to several conclusions.
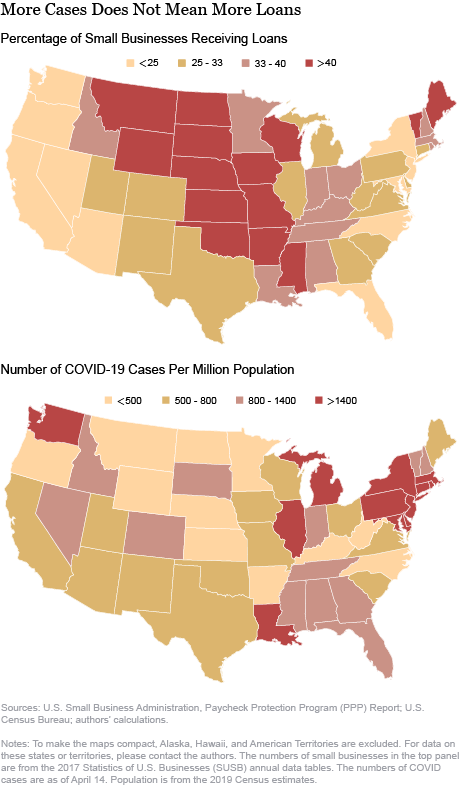
The percentage of small businesses receiving PPP loans was higher in many rural states than more populated states that have been harder-hit by the pandemic. The swath of states from Montana to Nebraska to Alabama are among those that have the highest percentages of small businesses receiving PPP loans, compared to more densely-populated states like California and New York. This disparity may be corrected in the second round of funding, as evidenced by California Governor Gavin Newsom’s assertion that the state has already received $33.2 billion – almost reaching the amount received in the entire first round ($33.4 billion).

COVID-19 prevalence was not shown to be a factor in the distribution of PPP loans. Hard-hit states such as New York have been economically devastated, as have states that implemented early social distancing regulations that have resulted in a lower number of cases. In fact, many states with a high number of cases, such as New York, New Jersey, and Michigan, were among the ones that had the lowest percentage of businesses receiving loans. States with few cases (almost the same swath across the country as mentioned above) have a higher percentage of businesses receiving PPP loans.
The data also shows that the distribution of PPP loans does not correlate with unemployment claims. The authors acknowledge that more analysis is needed to parse this relationship to find out if, for example, firms that received or expected to receive PPP loans were less likely to reduce their payroll. However, it is interesting to note that states with low unemployment rates (rural states like South Dakota and Oklahoma) were among the biggest beneficiaries of PPP.
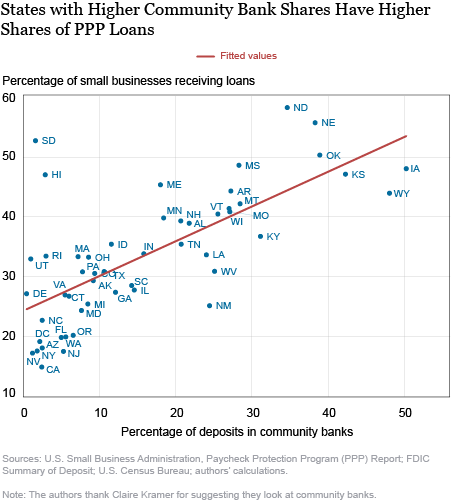
Community banks were not left out of the program. In fact, the analysis identified the market share of community banks as a possible explanation to the geographic distribution of PPP. As the authors put it:
“The four largest banks in the United States represent a significant share of the depository base but have (at most) a combined 12 percent share of the total amount lent through the PPP. Moreover, the fifteen largest banks originating PPP loans have just a combined 26 percent market share of the total dollar amount lent. It seems therefore that medium-sized and small banks, including community banks, are important in channeling PPP funding.”
Meanwhile, the percentage of deposits in community banks is a good predictor of the share of PPP loans received by small businesses.

Finally, the industry distribution of PPP loans shows an uneven pattern. While industries that have been hard-hit by the pandemic, such as healthcare and social assistance, have received a high amount of loans, it is not across the board. The construction industry is among the biggest beneficiaries of PPP, despite being designated an “essential service” and continuing operations in large parts of the country. Meanwhile, the accommodation and food services industry – arguably the most economically impacted – has received less funding than four other industries, some of which have not seen nearly as much disruption.
